Press Releases

Port Washington, N.Y., February 9, 2023 – While availability of internet and speed of that service can vary widely from state to state, or even county to county, there are a number of technology devices that have reached parity levels among connected households in rural and urban U.S. markets. Those include, TVs, video game consoles, smartwatches, activity trackers, and tablets, according to The NPD Group. However, the latest Connected Intelligence Broadband America Consumer Report reveals wider gaps exist in ownership levels of devices that are more dependent on an internet connection to reach their full potential. Examples include 4K TVs, where a broadband connection is required for high-definition streaming, and smart home devices, where higher download speeds are needed for live video streams.

In the U.S., 50% of households do not currently have a broadband connection (i.e., 25Mbps per second download speed or greater). In addition, 15% of homes in the U.S. have no internet access, while 10% use a smartphone-only solution. Based on NPD’s findings, this lack of internet access or lack of internet speed has the biggest impact on rural markets. As a result, in rural markets ownership of 4K TVs and home automation products have trailed ownership levels reported in urban areas. 

While other factors also influence this ownership gap, such as income levels, one theme that is consistent across 4K TV ownership for connected households in rural and urban markets is that as home internet download speeds increase, so too do household ownership levels. The same can be said of smart home devices, like internet security cameras that require higher download speeds. Conversely, ownership of DVD and Blu-ray players decline, as internet speeds grow because consumers are more likely to stream content when higher internet speeds are available.

“Consumers often experience buffering, when streaming in high definition without broadband access. As a result, homes with slower internet speeds have less incentive to purchase 4K TVs. In the case of smart TVs, while consumers may purchase them regardless of their internet connection, consumers with low internet speeds have lower usage, which presents a challenge for manufacturers that need usage data and advertising revenue to help sustain manufacturing,” said Eddie Hold, president of NPD Connected Intelligence. “The internet is essentially the lifeblood of all consumer electronics products. Understanding where coverage gaps exist can help explain trends and identify future opportunities.”

About Connected Intelligence

Connected Intelligence provides competitive intelligence and insight on the rapidly evolving consumer’s connected environment. The service focuses on the three core components of the connected market: the device, the broadband access that provides the connectivity and the content that drives consumer behavior. These three pillars of the connected ecosystem are analyzed through a comprehensive review of what is available, adopted, and consumed by the customer, as well as reviewing how the market will evolve over time and what the various vendors can do to best position themselves in this evolving market. For more information: http://www.connected-intelligence.com.

Resulting in Continued Evolution in Consumer Technology Ecosystems

Port Washington, NY, June 28, 2022 – In the last two years, adoption of connected devices in the U.S. saw steady growth with ownership of smart speakers up nearly 40% and home automation products more than doubling, according to The NPD Group. As a result, having an integrated ecosystem to seamlessly leverage this connected network is essential. Findings from NPD’s latest Evolving Ecosystem Report indicate smart speakers are securing their footing at the center of this ecosystem, as owners of these devices over index in ownership of other connected technology categories and digital voice assistant usage.

The report, which examines changing mobile, TV streaming, and smart speaker technologies through a lens of interconnectivity, reveals smart speaker owners are 35% more likely than the total market to own home automation devices, 26% more likely to own a streaming media player, and 21% more likely to own a connected smart TV. Smart speaker owners also use device voice commands at a higher rate than other device owners – with 91% of smart speaker owners noting they use the device’s voice commands, while only 72% of smartphone owners use voice control capabilities.  This underlines the emergence of other smart devices, not just smartphones, as more ubiquitous and useful within the home ecosystem.

“While two years ago the goal of ecosystem brands was to convert consumers who hadn’t yet adopted the technology, that has shifted to growing the existing base, which can be done by focusing on synergy among brands rather than strictly competing,” said Eddie Hold, president of the Connected Intelligence practice at NPD. “As we look to newer categories like smart appliances, it will continue to become more important and mutually beneficial for brands to make products versatile enough to be embraced by owners of different ecosystems rather than trying to have a product in every category.”

NPD’s newly released Evolving Ecosystem report examines device and service trends and ownership levels to understand the evolution of – and competition for – the coveted position of hub of the ecosystem. Data for the report was collected between February and March 2022. Beyond the adoption of devices and the preference for varying brands’ ecosystems, the report also examines the demographics of those using these technologies.

About Connected Intelligence

Connected Intelligence provides competitive intelligence and insight on the rapidly evolving consumer’s connected environment. The service focuses on the three core components of the connected market: the device, the broadband access that provides the connectivity and the content that drives consumer behavior. These three pillars of the connected ecosystem are analyzed through a comprehensive review of what is available, adopted, and consumed by the customer, as well as reviewing how the market will evolve over time and what the various vendors can do to best position themselves in this evolving market. For more information: http://www.connected-intelligence.com.

About The NPD Group

NPD is a global market information company offering data, industry expertise, and prescriptive analytics to help our clients understand today’s retail landscape and prepare for the future. Over 2,000 companies worldwide rely on us to help them measure, predict, and improve performance across all channels, including brick-and-mortar, e-commerce, and B2B. We have services in 21 countries worldwide, with operations spanning the Americas, Europe, and APAC. Practice areas include apparel, appliances, automotive, beauty, books, B2B technology, consumer technology, e-commerce, fashion accessories, food consumption, foodservice, footwear, home, home improvement, juvenile products, media entertainment, mobile, office supplies, retail, sports, toys, and video games. For more information, visit npd.com. Follow us on Twitter: @npdgroup

Cost is Number Two Reason for Canceling

Port Washington, NY, June 23, 2022 –According to The NPD Group, from October 2021 to April 2022, cost went from the #4 reason for cancelling a subscription video on demand (SVOD) service to #2. In fact, based on the latest TV Switching Study, consumers are also increasingly signing up for services based on promotional or discounted offers.

“In the last several months consumers have had to navigate rising prices in many facets of their lives and SVOD services are part of that mix with companies like Netflix and Amazon raising their subscription rates,” said John Buffone, executive director, industry analyst at NPD. “While cost considerations in SVOD services are still dramatically lower than in cable and satellite TV, it is important for providers to recognize that price sensitivity is growing so they can adjust their offerings to retain their subscriber base.”  

As of April 2022, promotional offers and discounted fees were more heavily influencing not only if consumers signed up for a SVOD service, but also their preferred method of sign-up (e.g., direct from the provider). In the survey period, the #1 reason cited for SVOD users signing up for a service was because of a free trial offering. At the same time, promotion/discount offers became the top reason driving preferred sign-up method, moving up four spots from October 2021 (among viewers extremely or very likely to subscribe to a SVOD service in the next six months). 

But while price and promotions/discounts play increasingly important roles, content remains critical to the consumer consideration set. Knowing that a specific TV show or movie was on a service drove one-third of SVOD users to sign-up, an increase versus six months ago, driven by younger viewers (up six percentage points).

“Consumers are creating a value equation to determine what services they ‘need’ versus those they cancel, especially as they return to experiential activities,” added Buffone. “For some consumers ad supported tiers can be a way to cut costs without losing access to content. As we look to the future – including potential AVOD offerings from Netflix and Disney – understanding the differing consumer value propositions will be key in determining tier structure and pricing strategies.”

When pricing tiers are available, survey results indicate that a customer who pays a premium for an ad-free experience is engaging with the service more frequently with 28% reporting using the service every day or most days vs. 20% of the ad-supported subscribers reporting the same. Consumers that pay a premium for ad-free viewing also place significantly more value in content availability, exclusivity, search, discovery, and user interface, indicating they are a more engaged consumer.

Methodology
The results of the NPD Group’s Connected Intelligence TV Service Switching Study are based on online consumer surveys of more than 5,000 U.S. consumers, aged 18+ from diverse regions and demographical backgrounds. The report was fielded from April 5- 21, 2022.

About Connected Intelligence
Connected Intelligence provides competitive intelligence and insight on the rapidly evolving consumer’s connected environment. The service focuses on the three core components of the connected market: the device, the broadband access that provides the connectivity and the content that drives consumer behavior. These three pillars of the connected ecosystem are analyzed through a comprehensive review of what is available, adopted, and consumed by the customer, as well as reviewing how the market will evolve over time and what the various vendors can do to best position themselves in this evolving market. For more information: http://www.connected-intelligence.com.

Port Washington, NY, March 8, 2022 – For many a broadband connection means having the ability to stream the latest binge-worthy shows, conference call with colleagues who are miles away, and monitor your home via smart devices from another state. But over the course of the pandemic broadband connections played a role in all that and more, keeping students connected to the classroom and patients connected to their doctors via telehealth. Despite the growing reliance on connected technology, the new Broadband America report from The NPD Group reveals that only 50% of homes in the continental U.S. have true broadband speed of 25Mbps download or higher.

In fact, 34% of homes receive internet access at speeds of less than 5Mbps, including 15% that do not have any internet access. Vermont, West Virginia, New Mexico, and Mississippi are among the least connected states, while New Jersey, Rhode Island, Maryland, and California are among the most connected. In Vermont only 24% of homes receive broadband speeds, while in New Jersey 65% of homes do.

“The so-called digital divide is a result of many factors including availability of suitable internet services and the affordability of services that are available in more rural parts of America,” explained Eddie Hold, president, NPD Connected Intelligence. “But there is potential for this situation to improve relatively quickly, as a result of the American Rescue Plan Act and the Infrastructure Investment and Jobs Act, which are providing key subsidies for deploying faster internet services, as well as funding the Affordable Connectivity Program which provides subsidized internet service to lower-income homes.”

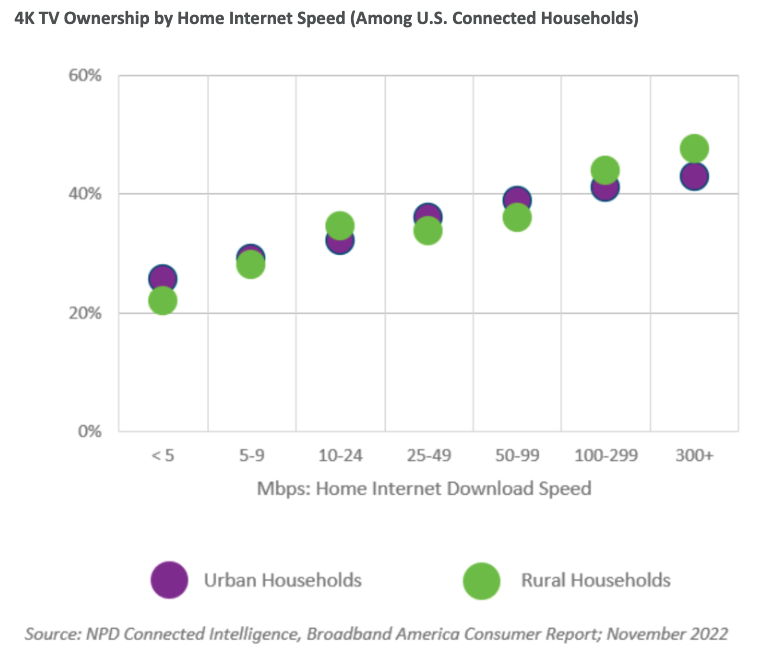
According to NPD’s Rural America report, more rural and less connected areas of the U.S. have far lower ownership levels of connected devices, as well as a higher level of price sensitivity for technology products ranging from TVs to streaming media players and beyond. In fact, while TV unit sales are roughly the same across rural and non-rural areas, the average price is 40% lower. When looking at streaming media players, unit sales are nearly 60% lower in rural areas. 

“The lack of higher-speed internet limits the opportunity for newer devices and services, as customers do not have the connectivity needed to generate a satisfactory experience,” noted Hold. “That has a ripple-on effect for consumer technology, limiting the need for larger, smarter TVs, streaming devices, or even tablets and newer PCs.”

Methodology

The report is based on a combination of sales data, speed test results, consumer surveys, FCC data and other sources to create a comprehensive view of the connected state of America today.

About Connected Intelligence

Connected Intelligence provides competitive intelligence and insight on the rapidly evolving consumer’s connected environment. The service focuses on the three core components of the connected market: the device, the broadband access that provides the connectivity and the content that drives consumer behavior. These three pillars of the connected ecosystem are analyzed through a comprehensive review of what is available, adopted, and consumed by the customer, as well as reviewing how the market will evolve over time and what the various vendors can do to best position themselves in this evolving market. For more information: http://www.connected-intelligence.com.

About The NPD Group, L.P.

NPD is a global market information company offering data, industry expertise, and prescriptive analytics to help our clients understand today’s retail landscape and prepare for the future. Over 2,000 companies worldwide rely on us to help them measure, predict, and improve performance across all channels, including brick-and-mortar, e-commerce, and B2B. We have services in 19 countries worldwide, with operations spanning the Americas, Europe, and APAC. Practice areas include apparel, appliances, automotive, beauty, books, B2B technology, consumer technology, e-commerce, fashion accessories, food consumption, foodservice, footwear, home, home improvement, juvenile products, media entertainment, mobile, office supplies, retail, sports, toys, and video games. For more information, visit npd.com. Follow us on Twitter: @npdgroup.

Press Contact

Megan Scott
516.625.7516   
megan.scott@npd.com

Installed Base Growth Was Fueled by Historic 2020 Consumer Technology Sales

Port Washington, NY, April 26, 2021 – Consumer technology sales have seen historic growth since the pandemic began as consumers purchased new products to meet their growing technology needs or upgraded existing devices. While the COVID-19 pandemic turned our homes into places of work, school, entertainment, and rest, the devices we leveraged grew and changed to accommodate this lifestyle. In fact, by February 2021, U.S. households had over one billion devices installed, connected, and able to deliver digital content to a screen.

According to NPD’s Device Ownership Trends & Profile Report, from February 2020 through February 2021, there was an increase of more than 100 million TV-connected and mobile devices installed in U.S. households. As of February 2021, U.S. internet homes have an average of 9.5 installed and connected devices, up from 8.5 in February 2020. These devices include connected TVs, streaming media players, Blu-ray disc players, video game consoles, laptops, desktops, tablets, and smartphones.

“Stay at home orders issued as a result of the pandemic played a part in the tremendous growth we saw in TV-connected and mobile devices last year as consumers looked for new or different ways to consume content while at home more often than they might otherwise be,” stated John Buffone, Executive Director, Industry Analyst within NPD’s Connected Intelligence practice. “This influx of newer hardware and the growing installed base will continue to facilitate the accelerated growth in free and subscription streaming video during 2021 and beyond.”

Methodology

The results of The NPD Group’s Connected Intelligence Device Ownership Trends Report are based on NPD’s quarterly Connected Home survey, which reaches 5,000 U.S. consumers, aged 18+ from diverse regions and demographical backgrounds. They report on more than 12,500 TVs installed in over 37,000 household rooms. This survey was fielded between January 25 and February 11, 2021.

Port Washington, NY, February 17, 2021 – According to the latest Home Automation Ownership & Usage Report from NPD’s Connected Intelligence, half of U.S. consumers own at least one smart home device, up from 35% in January of 2020. While security cameras remain the most commonly owned smart home device, NPD’s Retail Tracking Service data reveals the largest sales gains in 2020 were seen in security systems (+44%), smart garage door openers (+21%), and smart lighting (+19%).1

Security is a key motivator in smart home device purchases, and as such security cameras have been the leading volume driver for the past four years. In fact, they made up nearly one out of every four smart home device purchases at retail in 2020, the most of any device type. However, as many consumers shifted their focus to home projects during 2020 driven by pandemic restrictions, we saw growth in more convenience-driven categories. From January 2020 to October 2020 overall penetration in the smart lighting category grew from 8% to 12% driven in part by new smart homeowners (defined as those who purchased their devices from April-September 2020). Unit sales of smart lighting also saw strong gains up 43% in 2020 compared to 17% growth in 2019.

“While the pandemic played a role in sparking interest in additional smart home categories, the challenge to continue to grow the addressable market moving forward is in part average sales prices,” said Jill Aldort, director, industry analyst for The NPD Group. “Home automation ownership rates in households with an income of $150K+ are more than double those of under $45K income. As the landscape grows with new brands and new product lines from established brands, there could be opportunity for growth across a variety of categories at new price points.”

According to NPD’s Future of Tech report, smart home devices sales are forecasted to continue their growth in 2021, with sales up 9% over 2020. Some segments expected to drive the industry forward with at least twice that growth include smart locks, smart entry, and smart lighting.2

1Source: The NPD Group, Inc., U.S. Retail Tracking Service. Home automation devices do not include Smart speakers.
2Based on forecasted sales of technology products captured in The NPD Group Retail Tracking Service point-of-sale data, Streaming Audio Speakers Total Market report, and Smartwatch Total Market report. This does not include mobile phones or gaming consoles.

Methodology

The NPD Group Connected Intelligence Home Automation Ownership & Usage Survey is based on consumer panel research that reaches over 5,000 U.S. consumers, aged 18+ from diverse regions and demographical backgrounds. The survey was fielded between October 9-29, 2020.

Content remains king, driving consumer engagement with subscription video-on-demand services

Port Washington, NY, December 14, 2020 – This year saw an accelerated transition of viewing from traditional channels to free and subscription streaming video services, as consumers had more options to choose from and more time at home due to COVID restrictions. According to The NPD Group’s new TV Switching Study, which tracks changes in the ways U.S. consumers view and buy digital content, consumers that use streaming to view content now use seven services including subscription video-on-demand (SVOD) services and free streaming video services, up from five in April 2020.

“By and large, consumers want the ability to customize their viewing experience, bundling both paid and free services that provide them with the content they want, when they want it,” stated John Buffone, Executive Director, Industry Analyst within NPD’s Connected Intelligence practice.

Access to exclusive content is a primary reason cited for engaging SVOD services, driving over 25% of engagement, while also resulting in a consumer’s desire to switch services. In fact, an increasing number of SVOD users – 21% in Oct. compared to 14% in April – are decreasing engagement or cancelling subscriptions because they feel other services offer better content.

Free streaming services saw growth from 39% of viewers in April to 47% in October*, as consumers leverage these offerings to supplement SVOD services. While nearly all free streaming services experience lower churn than average, as consumers do not have to subscribe to these platforms, they also experience lower engagement rates. This means these services must differentiate their content array or risk declining user engagement.

“Amidst COVID-related content production challenges, viewers are increasing the number of streaming services they use, as they seek to find content that captures their interest. Competition will become an even greater challenge for services. Both now, as viewers try more options and later as production ramps up and each service gets new programming,” added Buffone.

*Note: April 2020 data included past year free streaming users, while October 2020 data included past six month users.

Methodology
The results of the NPD Group’s Connected Intelligence TV Service Switching Study are based on online consumer surveys of more than 5,000 U.S. consumers. The report was fielded in October 14-22, 2020.

About Connected Intelligence
Connected Intelligence provides competitive intelligence and insight on the rapidly evolving consumer’s connected environment. The service focuses on the three core components of the connected market: the device, the broadband access that provides the connectivity and the content that drives consumer behavior. These three pillars of the connected ecosystem are analyzed through a comprehensive review of what is available, adopted, and consumed by the customer, as well as reviewing how the market will evolve over time and what the various vendors can do to best position themselves in this evolving market. For more information: http://www.connected-intelligence.com.

Verizon is buying prepaid mobile phone operator Tracfone in the latest seismic shift in the U.S. mobile market. The deal, reportedly worth $6.25 billion, will add 21 million subscribers to Verizon’s base and – far more importantly – strengthen Verizon’s prepaid portfolio which has always been relatively weak compared to the other major carriers. T-Mobile has Metro, AT&T has Cricket and now, Verizon will have Tracfone.

But it’s not quite as simple as that: while Verizon is adding 21 million subscribers, it was already making money off a large number of these (13 million) subscribers through a wholesale agreement with Tracfone, which does not own its own network, but rather wholesales from the main carriers. So the increased Verizon subscriber base will not result in quite as much revenue as a simple one plus one merger. That being said, with nearly two-thirds of the Tracfone base already using Verizon-compatible devices, the headache of merging the Tracfone customer base into the Verizon fold is significantly lower than a typical carrier merger would be. At the same time, the other carriers will take a hit in wholesale revenue, as both AT&T and the new T-Mobile also have wholesale agreements to support Tracfone and we can expect those to disappear at some point soon after the merger’s consummation, impacting both carriers’ bottom lines. Further, we can expect Verizon to come out of the acquisition process with guns a-blazing, upgrading Tracfone’s available network (5G anyone?) and generally making the carrier even more competitive.

While the deal will certainly increase pressure on T-Mobile and AT&T, the biggest impact may be felt by Dish, which now owns the Boost Mobile brand. Still in the process of developing a comprehensive mobile strategy, Dish will probably face a more aggressive prepaid focus from Verizon, as well as from the other two major networks looking to defend their turf against potential moves from the combined Tracfone/Verizon entity.

But that is likely 12 months from now, so Dish should have time to benefit from any upheaval caused by the merger. It could be a case of a short-term benefit (for Dish) with a longer term concern. In that case, it comes down to how quickly Dish can react to this news to make the most of any opportunity. And, of course, let’s not forget the obligatory regulatory hurdles that Verizon and Tracfone must overcome. But that should be a relatively smooth process: yes, this takes a competitor out of the market, but Tracfone does not own its own network so it could be argued that as a virtual operator the impact is less on the competitive landscape. Time will tell.

Only 18% of consumers report understanding of the different 5G network types currently available in the U.S.

Port Washington, NY, September 14, 2020 – While 5G technology has not yet been widely adopted, the majority of U.S. consumers are aware of 5G and the promise of super-fast data transmissions that enable superior multimedia streaming and enhanced gaming experiences on mobile devices. In fact, according to the latest Mobile Connectivity Report from NPD’s Connected Intelligence, 9 out of 10 consumers are aware of 5G networks; however, only 18% have heard of and understand the difference between the 5G network band types such as mid-band or high-band (Millimeter Wave) currently available in the U.S.

Generally, Android users have a higher level of awareness of the varieties of 5G networks currently available. In fact, 45% of Android users compared to 40% of iOS users are aware that there are different 5G network options. Despite the lack of knowledge around various 5G network types, 2 out of 3 consumers currently report interest in purchasing a 5G-enabled smartphone. Based on the report findings, iOS users show higher levels of interest (40% extremely or very interested) than Android users (33% extremely or very interested). 

“5G-enabled Android devices have been available to consumers, which may explain their increased awareness of 5G flavors, while iOS users have not yet had the opportunity to upgrade to 5G. Given the stronger interest from iOS users, a 5G-enabled iPhone could help drive adoption” said Brad Akyuz, executive director, industry analyst, NPD Connected Intelligence. “On the other hand, the current premature state of 5G networks in terms of speed and coverage will continue to be a barrier in the mass adoption of 5G smartphones. 5G smartphone volumes are poised to increase as networks improve and 5G smartphone prices gradually decrease.”    

Methodology
The results of The NPD Group Connected Intelligence Mobile Connectivity Report are based on consumer panel research that reached 5,100 U.S. cellphone users, aged 18+ from diverse regions and demographical backgrounds. This survey was completed in August 2020.

About Connected Intelligence
Connected Intelligence provides competitive intelligence and insight on the rapidly evolving consumer’s connected environment. The service focuses on the three core components of the connected market: the device, the broadband access that provides the connectivity and the content that drives consumer behavior. These three pillars of the connected ecosystem are analyzed through a comprehensive review of what is available, adopted, and consumed by the customer, as well as reviewing how the market will evolve over time and what the various vendors can do to best position themselves in this evolving market. For more information: http://www.connected-intelligence.com.

Port Washington, NY, July 9, 2020 – The unlocked mobile phone market continues its upward trajectory with an estimated 50.1 million active unlocked smartphones running on U.S. mobile networks, an increase of eight percent[1] based on the latest findings from NPD’s Unlocked Phone Demand Report 5.0. However, despite this growth in units, tailwinds are slowing, likely due to expanding 5G networks and offerings as well as store closures occurring during the COVID-19 pandemic.

“Bolstered by aggressive promotions from carriers, the BYOD [Bring-Your-Own-Device] trend continues to rise, as we saw over 20 percent of customers switching to a new service provider bring their own unlocked smartphones with them[2],” said Brad Akyuz, Executive Director and Industry Analyst, NPD Connected Intelligence. “Yet it’s difficult to overlook the impacts on this market from forces such as COVID-19 and a growing interest in 5G adoption.” 

5G Awareness, COVID Threaten the Unlocked Mobile Market (Not in the way conspiracy theorists assert)

Awareness of 5G services have reached record high levels thanks to the continual marketing pushes made by carriers. Unlocked smartphone users, who generally tend to be more tech-savvy than average smartphone users, unsurprisingly over-indexed in their awareness of the 5G technology.

[1] From the end of Q1’2019 to Q1’2020

[2] February 2020

In fact, 42 percent of unlocked smartphone owners cited they would be very or extremely interested in purchasing a 5G smartphone compared to only 31 percent of locked phone owners. This eagerness could slow any momentum in the unlocked market, as non-uniform 5G network deployments make it complex to use an unlocked smartphone on any network at its full 5G potential.

Additionally, store closures as a result of the COVID-19 pandemic limited mobile phone churn activity, long known to be essential for the sales of new locked and unlocked smartphones. As carriers had to migrate to online strategies, lowered operating costs afforded them the opportunity to offer additional subsidies on locked phones. Likewise, even after physical locations began reopening, carriers that want to continue to attract smartphone buyers are offering extended financing options, making locked devices more appealing than ever.

“A number of factors are converging to make locked mobile devices more attractive to consumers who are in the market for a new or upgraded phone,” added Akyuz. “We expect cash-constrained customers in a post-COVID marketplace will either delay device upgrades or opt for cost-effective locked alternatives.” 

Methodology

The results of the NPD Group Connected Intelligence Unlocked Phone Demand Report 5.0 are based on online consumer panel research of over 1,500 U.S. unlocked smartphone owners, aged 18+ from diverse regions and demographical backgrounds. This survey was fielded in May 2020.

About Connected Intelligence

Connected Intelligence provides competitive intelligence and insight on the rapidly evolving consumer’s connected environment. The service focuses on the three core components of the connected market: the device, the broadband access that provides the connectivity and the content that drives consumer behavior. These three pillars of the connected ecosystem are analyzed through a comprehensive review of what is available, adopted, and consumed by the customer, as well as reviewing how the market will evolve over time and what the various vendors can do to best position themselves in this evolving market. For more information: http://www.connected-intelligence.com.

About The NPD Group, Inc.

NPD offers data, industry expertise, and prescriptive analytics to help our clients grow their businesses in a changing world. Over 2000 companies worldwide rely on us to help them measure, predict, and improve performance across all channels, including brick-and-mortar and e-commerce. We have offices in 27 cities worldwide, with operations spanning the Americas, Europe, and APAC. Practice areas include apparel, appliances, automotive, beauty, books, B2B technology, consumer technology, e-commerce, fashion accessories, food consumption, foodservice, footwear, home, juvenile products, media entertainment, mobile, office supplies, retail, sports, toys, travel retail, video games, and watches / jewelry. For more information, visit npd.com. Follow us on Twitter: @npdgroup.


Press Contact

Lauren Leetun

Lauren.Leetun@npd.com

407.592.7923

Pages